We have spoken before on the importance of CFD in effective reactor design and the benefits in shortening the design cycle “CFD and why it is a must have” Optical modelling is the other part of the equation, describing how UV power is used within a system and has similar benefits to CFD analysis.
There are many approaches to optical modelling, though Ray Tracing has emerged as the preferred method for novel system designs and complex 3D targets. Ray Tracing is a method bolstered by the computer gaming and cinematic CGI industries, where custom light sources must interact with bespoke ‘scenes’ in a physically realistic manner.
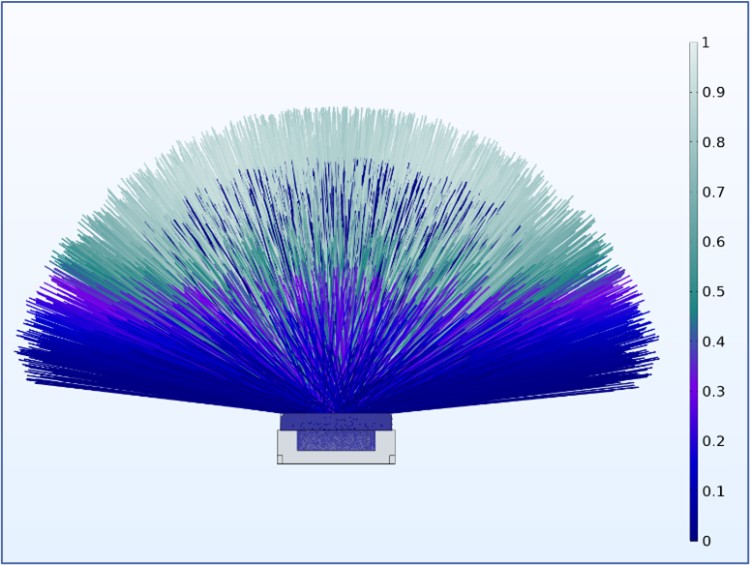
Figure 1. Rays projected from an LED source in a photometric model; note the lower intensity of radiation emitted at wider angles and ‘secondary’ rays generated from quartz window interactions.
The basic principle is to ‘launch’ millions of light rays from the source and track their reflections, refractions, and absorption; the result is a 3-dimensional ‘fluence rate field’ or ‘irradiance map’, depending on the target of the system.
Ray Tracing allows engineers and designers to visualize how UV power is delivered to the target volume or surface, quantify the performance of the current design, and rapidly inform future design decisions.
Our method can be applied to conventional and LED emitters across a wide range of applications (e.g., HVAC, surface disinfection, upper-room UVGI, water treatment, UV photochemistry).
The process:
1. Defining the ‘scene’ and source
a. Usually imported as a CAD geometry, this is the digital representation of the system to be modelled.
b. The ‘Target’ can be a surface, or volume to be irradiated.
c. ‘Meshing’ converts the scene into geometric elements.
d. The ‘Source’ is the UV emitter, with controllable position, size, orientation, spatial emission profile, and spectral emission profile.
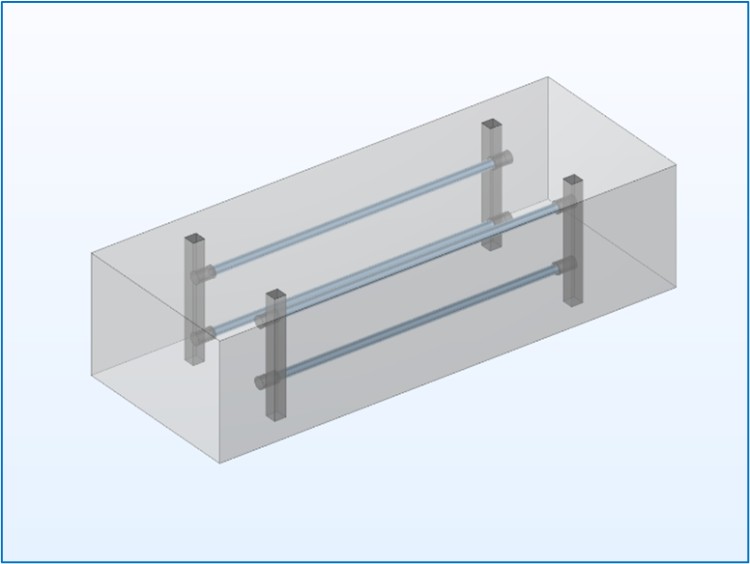
Figure 2. A basic HVAC conduit CAD model with four conventional LP Hg lamps installed parallel to the direction of airflow.
2. Launch rays into the scene!
a. Reflection
b. Refraction
c. Absorption
d. Scattering
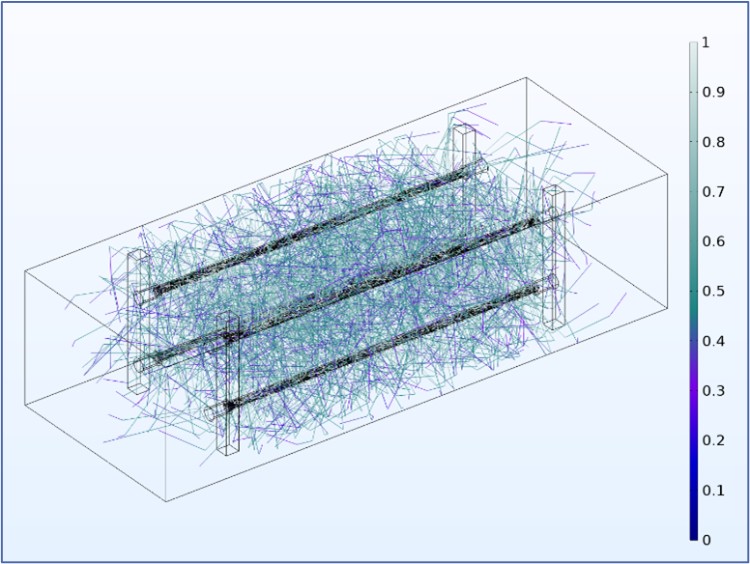
Figure 3. Illustration of ray propagation from the four UV lamps; rays are launched according to a physically realistic model and move through the model, undergoing reflection, refraction, and absorption with each interaction.
3. Data analysis and interpretation
a. Ray traces show the path of the light through the scene.
b. Spatial irradiance/fluence rate maps illustrate how the system delivers UV power.
c. Histograms and statistical parameters describe performance.

Figure 4. 3-dimensional distribution of fluence rate within the conduit, mapping regions of high and low intensity through the air volume. Note the very high fluence rate around each lamp surface, with a local minimum along the central axis.
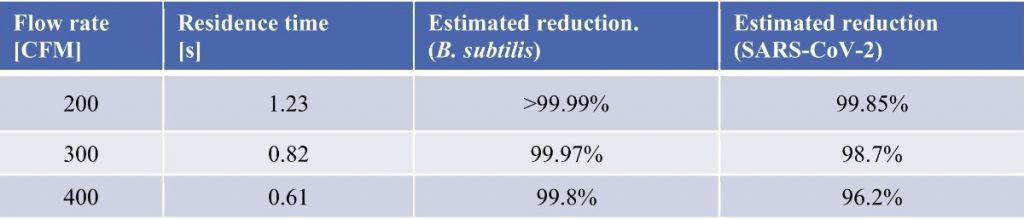
Table 1. Example output showing pathogen-specific estimated reduction data
If you have any questions, please contact me!
Karl Platzer
Consulting M&A Business Development LLC.
8887 Crown Colony Blvd.
Fort Myers, FL – 33908
phone: +1 239 738 0664
email: platzer@uvlampconsulting.com